Experimental variogram
Overview
The 3D variogram algorithm is based on geostatsmodels (which only handles 2D datasets). Its goal is to be compliant with Isatis variogram outputs.
This algorithm is also suitable for 2D inputs.
Algorithm
Compute 3D distances pairwaise between points in dataset
Identify pairs of points included in a lag range
Given azimuth(as geographic angle), dip and pitch angle inputs, identify pairs belonging to an angular range (considering an input angular tolerance). Matching pairs are also selected at opposite angle (180° azimuth rotation)
The semivariance (or covariogram, depending on user’s choice) is then computed for all the lags, according to the input values of each points for all the selected pairs.
Technical details
Librairies
The variogram algorithm is written in Python, and heavily relies on numpy and pandas libraries for computations and data management.
Angular adjustments
Angular calculus
All of the angular calculus are made in radians, so as to minimize angle conversions during computations. Degree to radian conversion is done once for all before applying all of the algorithm steps.
Geographic to arithmetic conversion
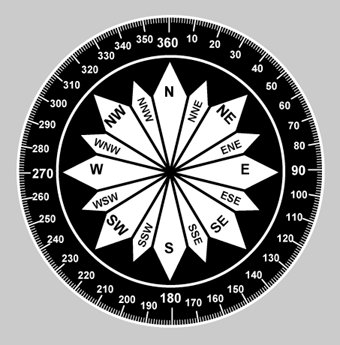
Azimuth angle is given as a compass bearing in the range [0,360] degrees (north as 0° geographic, 90° arithmetic). Conversion from geographic to arithmetic is required before applying the rotation matrices.
Angular range conversion
Most of the numpy angle computations (arccos, arcsin and arctan2) outputs are given in the [-pi, pi] range. In order to handle angle wrapping, most of the angle management in the algorithm done with angle normalization.
Trend and plunge conversion
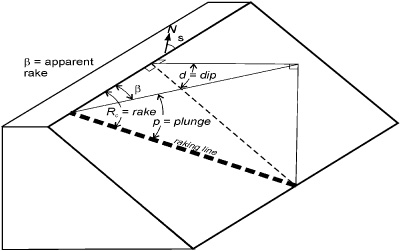
Azimuth, dip and pitch angles are given as input for trend and plunge computation. They are used later on for distance pairs rotation.
Where A is the geographic azimuth, D the dip and R the rake or pitch.
Rotation matrix
Once the pairs of points have been selected, and according to the operator inputs on azimuth, dip and pitch angles, rotation matrices are applied clockwise on the selected pairs of points. The rotation matrices used for 3D rotation of the pairs vector can also handle counter clockwise rotation (but clockwise is set as default).

Angular range calculus
The angle between the directional vector (defined by its azimuth, dip and pitch angles) and the index pair vector is done using a dot product. The resulting angle is then compared within the angular tolerance given as input argument.
Output
The geolime variogram output is intended to be as close as Isatis output. A typical geolime variogram output:
rank npairs  lag  avgdist        vario
0     4      1   60  57.6806  1568.000000
1     5      3   75  71.9403  2608.166667
2     6      2   90  86.3444   759.250000
3     7      1  105  105.894    32.000000
4     8      2  120  122.254   740.000000
5     9      2  135  130.186  5870.250000
6    10      2  150  151.782   900.250000
7    11      2  165  170.897  2866.250000
8    12      2  180  185.647  2358.250000
9    13      4  195  198.692   345.625000
10   14     10  210  211.139  1274.000000